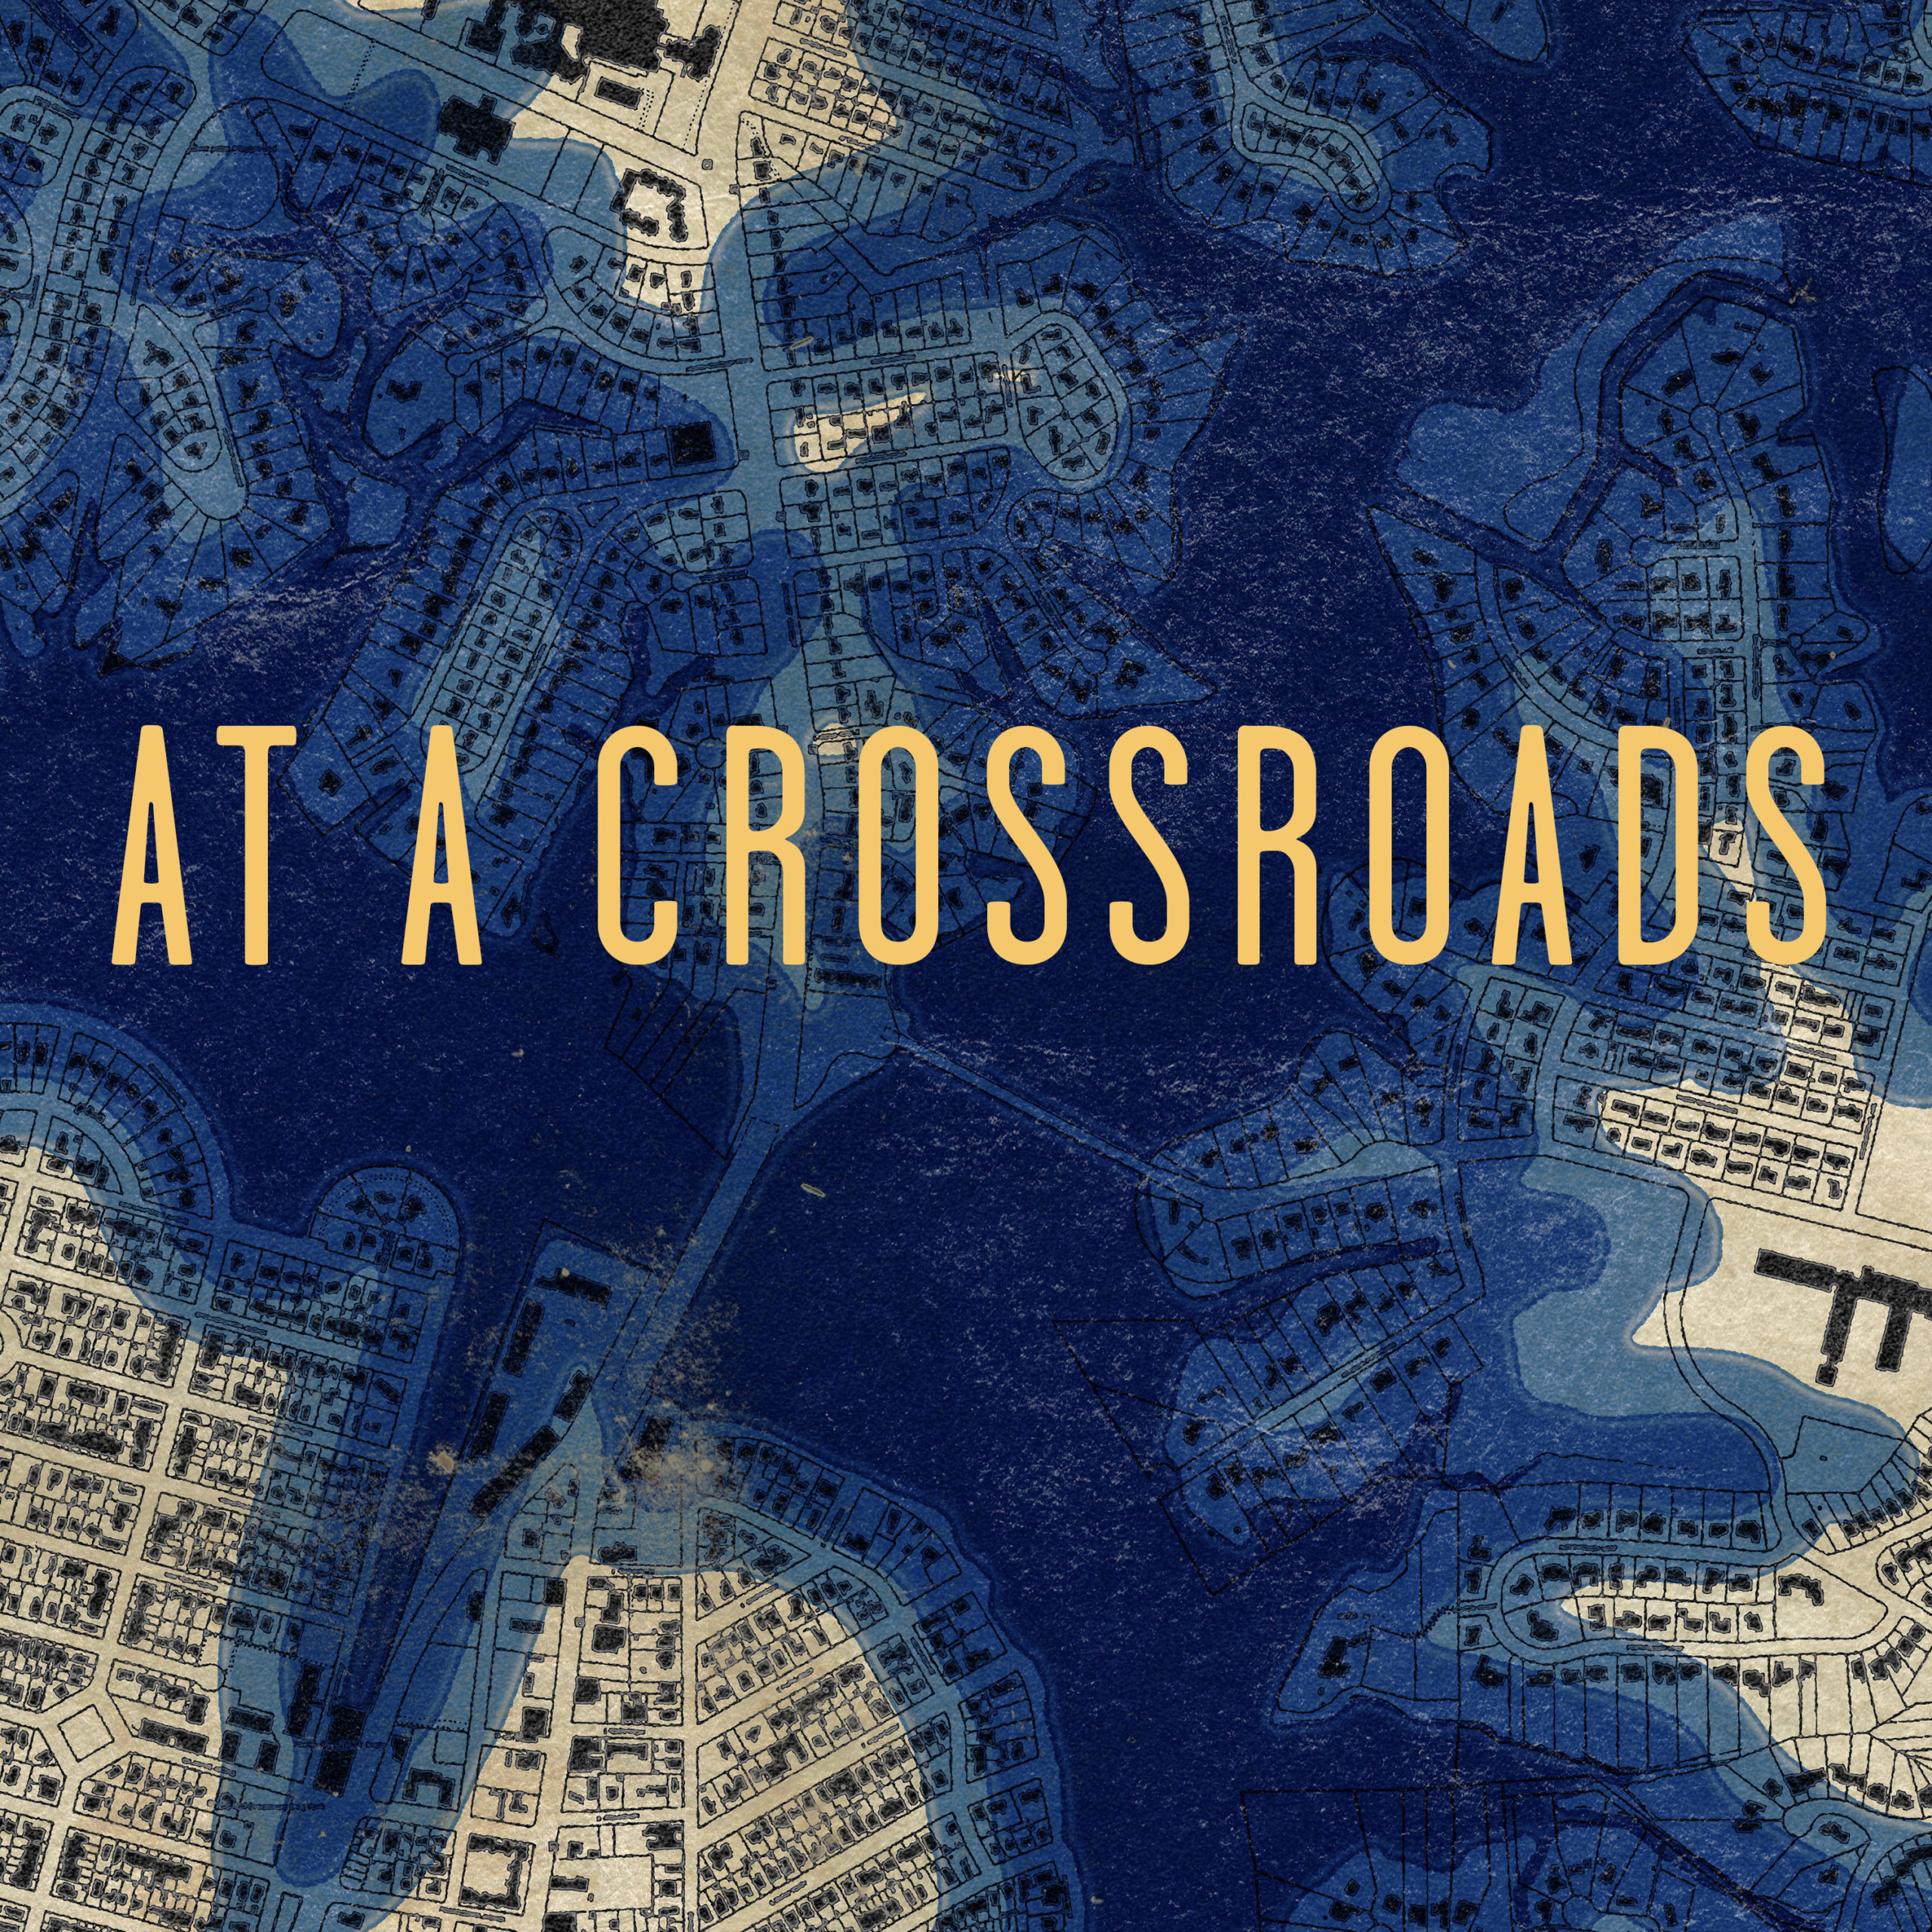
This map displays projected flooding around Coastal Virginia over the next 60 years. It includes layers showing social vulnerability per census tract using the Centers for Disease Control’s 2018 Social Vulnerability Index (SVI), historical redlining data (University of Richmond Digital Scholarship Lab) for some areas of southeast Virginia and the number of flooded structures for socially vulnerable census tracts.
The flood projections are based on the National Oceanic and Atmospheric Administration’s Intermediate-High curve, per the recommendation of the Commonwealth Center for Recurrent Flooding Resiliency (CCRFR).
The purpose of the map is to show which neighborhoods are most at risk from sea level rise and whether those communities are also socially vulnerable and historically disadvantaged.
Data links:
- Global and Regional Sea Level Rise Scenarios for the United States – NOAA
- CDC’s 2018 Social Vulnerability Index
- Univ. of Richmond DSL Redlining Data
This web application was developed by Old Dominion University’s Center for Geospatial Science, Education, and Analytics (GeoSEA)’s GIS Analyst, Christopher Davis.
Map and data development were supported in part by the Commonwealth Center for Recurrent Flooding Resiliency and ODU’s Institute for Coastal Adaptation and Resilience (ICAR).
